
More Information
Submitted: June 13, 2022 | Approved: June 21, 2022 | Published: June 22, 2022
How to cite this article: Ashour S, Bayram R. Novel extractive visible spectrophotometric method for determination of antihypertensive drug irbesartan with sulfonephthalein acid dyes in tablets. Arch Pharm Pharma Sci. 2022; 6: 006-012.
DOI: 10.29328/journal.apps.1001029
Copyright License: © 2022 Ashour S, et al. This is an open access article distributed under the Creative Commons Attribution License, which permits unrestricted use, distribution, and reproduction in any medium, provided the original work is properly cited.
Keywords: Extractive spectrophotometry; Irbesartan; Bromophenol blue (BPB); Bromocresol purple (BCP); Pharmaceuticals

Novel extractive visible spectrophotometric method for determination of antihypertensive drug irbesartan with sulfonephthalein acid dyes in tablets
Safwan Ashour1* and Roula Bayram2
1Faculty of Engineering, University of Gaziantep, Gaziantep, Turkey
2Department of Pharmaceutical Chemistry, Pharmacy Program, Batterjee Medical College, Jeddah, Kingdom of Saudi Arabia
*Address for Correspondence: Safwan Ashour, Faculty of Engineering, University of Gaziantep, Gaziantep, Turkey, Email: [email protected]; [email protected]
Irbesartan (IRB) is one of the drugs used for the treatment of hypertension. The present work develops and validates two methods for the evaluation of irbesartan in bulk and tablets. Sulfonephthalein acid dyes, bromophenol blue (BPB), and bromocresol purple (BCP) were used to produce stable yellow ion-association complexes with the basic drug IRB in dry chloroform. The colored products are quantified spectrophotometrically at their corresponding λmax. The relation between the absorbed signal and the drug concentration was linear up to 45.0 μg mL-1 (n = 6, r ≥ 0.9998). LOD reaches 40 ng mL-1. The composition of the ion associates was found 1:1 by Job’s and mole ratio methods. Application of the suggested methods to dosage forms is presented with percentage recoveries ranging from 99.33% to 101.67%. The results of the analysis were validated statistically and compared with the official method. No interference was observed from common pharmaceutical adjuvants.
Irbesartan, 2-butyl-3-[[4-[2-(2H-tetrazol-5-yl)phenyl]phenyl]methyl]-1,3-diazaspiro [4.4]non-1-en-4-one, is anti-hypertensive [1]. Clinically irbesartan is administered in tablets for the treatment of hypertension. Based on its mechanism of action, irbesartan has the potential to offer advantages in safety and tolerability over previous classes of drugs in the treatment of hypertension, diabetic nephropathy, and heart failure [2]. BP [1] and USP [3] reported the HPLC method for the estimation of irbesartan. Several different techniques were presented for the quantitative determination of IRB in pharmaceutical formulations. The methods described include kinetic spectrophotometry [4,5], spectrofluorometry [6–8], spectrophotometry [7–10], HPLC [7,11–14], HPTLC [15], titrimetry using NaOH [16] and voltammetry [17]. Irbesartan with other drugs was determined in the combined formulations by UV derivative spectrophotometry [18–24], spectrophotometry [25,26], capillary electrophoresis [27,28], and HPLC [29–37].
The literature is still poor in analytical assay methods based on extractive spectrophotometry for the determination of irbesartan in tablets. Two extractive spectrophotometric methods were found which are based on the extraction of irbesartan with picric acid, BCG, BTB, Co(II) thiocyanate, and Mo(V) thiocyanate [38] and with naphthol blue-black [39]. Extractive spectrophotometric procedures are the best choice for quality control because of their high sensitivity, selectivity, and low limit of detection in the assay of drugs [39–41].
To date, an extractive spectrophotometric method for the estimation of irbesartan with bromophenol blue and bromocresol purple has not been published in the open literature. Therefore, this paper reports new simple and sensitive methods for the evaluation of irbesartan based on the interaction of the basic drug with sulfonephthalein acid dyes.
Instrumentation
UV–VIS spectrophotometer (Jasco V-530, Japan) with 1 cm quartz cells and pH meter (Suntex-SP 701, Taiwan) equipped with combined glass pH electrode was used. The operating conditions are scan speed medium (400 nm/min), scan range 360–500 nm, and slit width 2 nm. Spectra were automatically obtained by Jasco system software. The temperature was maintained at 25 ± 2 °C.
Materials and chemicals
Pharmaceutical grade irbesartan (IRB) supplied by Cipex Specialities, India. Irbesartan purity was determined according to BP [1] and found to be 99.67%. Aprovel® (Sanofi, France) and Rovil (BPI, Aleppo, Syria) tablets are labeled to contain 150 mg of irbesartan per tablet. Bromophenol blue (BPB) and bromocresol purple (BCP) 1×10⁻³ M solutions in water, chloroform, anhydrous sodium sulfate, and bi-distilled water were used. The pH value was adjusted using Britton buffers (pH 1.3 to 4.0), these buffers were prepared by mixing certain volumes of 0.2 M boric acid, 0.2 M acetic acid, and 0.2 M phosphoric acid. All chemicals and reagents were of AR grade (Merck, Germany).
Standard solutions to the drug
A standard stock solution of IRB was provided (0.5 mg mL-1) by dissolving the required weight of irbesartan in 5 mL of glacial acetic acid, the volume was diluted in a 100 mL volumetric flask to the mark with bi-distilled water. Working standard solutions were then prepared by diluting the stock standard solution with the same water. The solutions were stable for a period not exceeding 10 days when kept in a dark place and at a temperature of 2–8 °C.
General procedure
4 mL of buffer solution of pH 1.6 or 2 mL of buffer solution of pH 2 and 6 mL of BCP or 5 mL of BPB were added into a series of 50 mL separating funnels, respectively. A required volume of IRB 0.5 mg mL-1 standard solution (30–860 µL for BCP; 36–900 µL for BPB) and 10 mL of chloroform were added to each funnel. The funnels were shaken vigorously for 2 min and then left for clear separation of the water and chloroform phases. The separated chloroform phase was transferred to a 50 mL beaker, dried over anhydrous Na2SO4, and then transferred to a volumetric flask of 10 mL. Finally, the extract was made up to the mark with chloroform and mixed. The absorbance of the chloroform phase was measured at 420 nm for both BCP and BPB against a reagent blank similarly prepared. The calibration graph was constructed to calculate the amount of the analyst drug in unknown samples. The color is stable for at least 48 hrs up to 30 °C.
Stoichiometry of the formed ion-pairs
Job’s of continuous variation and molar ratio methods were applied to determine the reaction stoichiometry between IRB and dye [42]. In the first method, a series of IRB−dye solutions was kept at 2.0 mL (0:2, 0.2:1.8, 0.4:1.6, 0.6:1.4, 0.8:1.2, 1.0:1.0, 1.2:0.8, 1.4:0.6, 1.6:0.4, 1.8:0.2, 2:0) where CIRB+Cdye=2×10⁻⁴ M. The reagent was mixed in various proportions and then diluted to volume in a 10 mL calibrated flask with chloroform. The absorbance of the resulting solutions was measured at 420 nm against similarly treated reagent blanks. While in the second method, equimolar solutions of IRB and dye (1×10⁻³ M) were used. Different aliquots of dye were added to fixed aliquots of IRB solution –total volume 10 mL– and the absorbance was measured at 420 nm against similarly treated reagent blanks.
Procedure for tablets
Twenty tablets containing irbesartan were weighed and finely powdered. A portion of the powder equivalent to 25 mg of IRB was accurately weighed, dissolved in 5 mL of glacial acetic acid, and swirled for 15 minutes. 5 mL of bi-distilled water was added and then filtered. The solution was diluted in a 25 mL volumetric flask to the volume with bi-distilled water. The general assay was then applied within the Beer’s law limit of the developed method.
Irbesartan forms yellow ion-pair complexes, in an acidic buffer, with sulfonephthalein acid dyes such as BCP and BPB. The absorption spectra of the quantitatively extracted complexes IRB−BCP and IRB−BPB into chloroform exhibited maximum absorbance at 420 nm and the colorless reagent blanks showed negligible absorption, as shown in Figure 1.
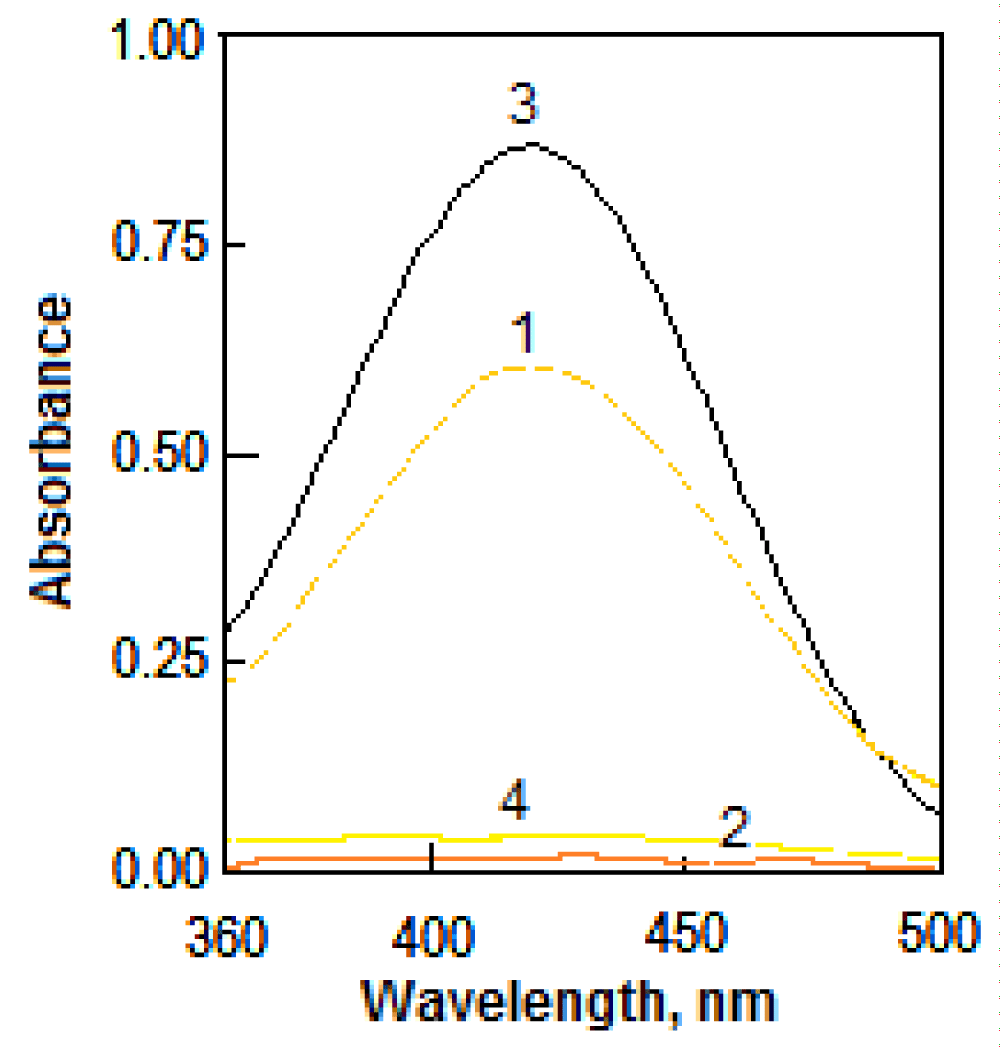
Figure 1: Spectra of IRB-dye complexes in chloroform: (1) 12 µg mL-1 of IRB+6 mL of 10-3 M BCP+4 mL of pH 1.6 buffer against its respective blank (2) and (3) 20 µg mL-1 of IRB+5 mL of 10-3 M BPB+2 mL of pH 2 buffer against its respective blank (4).
The required optimum conditions for quantitative and rapid formation of yellow ion-pair complexes were investigated. Chloroform was the best of the other used solvents for its quantitative and selective extraction. The suitable buffer was found to be a Britton buffer for both methods. The effect of pH on the IRB–reagent complex was investigated by extracting the colored complexes in the presence of Britton buffer over the pH range 1.3−3.0. The maximum color intensity and highest absorbance value were observed at pH 1.6 using 4 mL of buffer for BCP and at pH 2.0 using 2 mL of buffer for BPB (Figures 2,3).
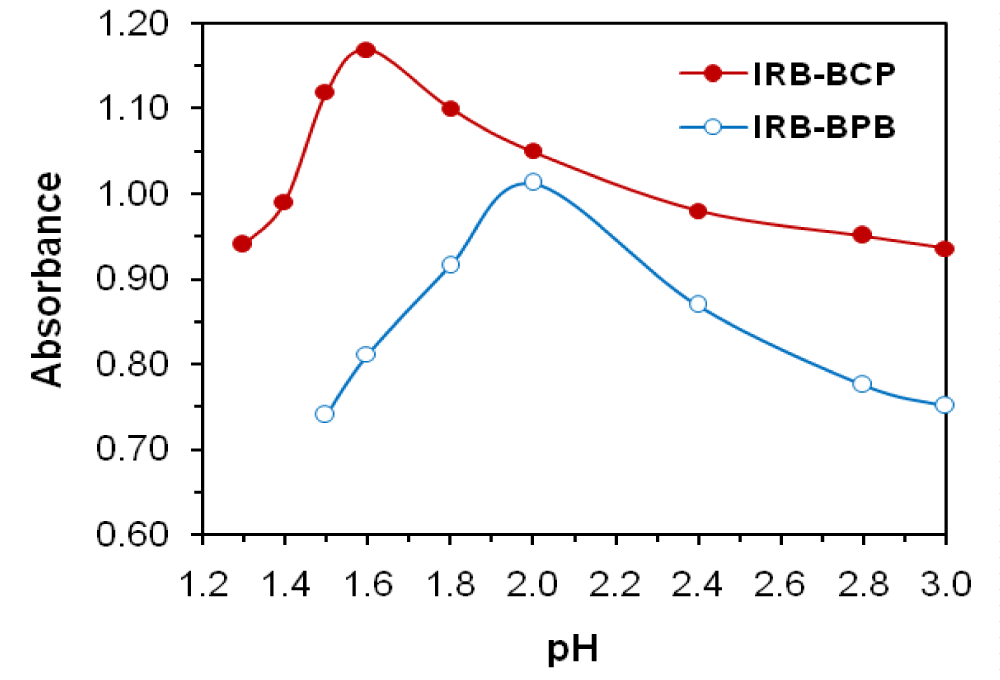
Figure 2: Effect of pH on the absorbance at λmax of IRB (27.5 µg mL-1)−BCP (0.6 M) and IRB (27.5 µg mL-1)−BPB (0.5 M) complexes.
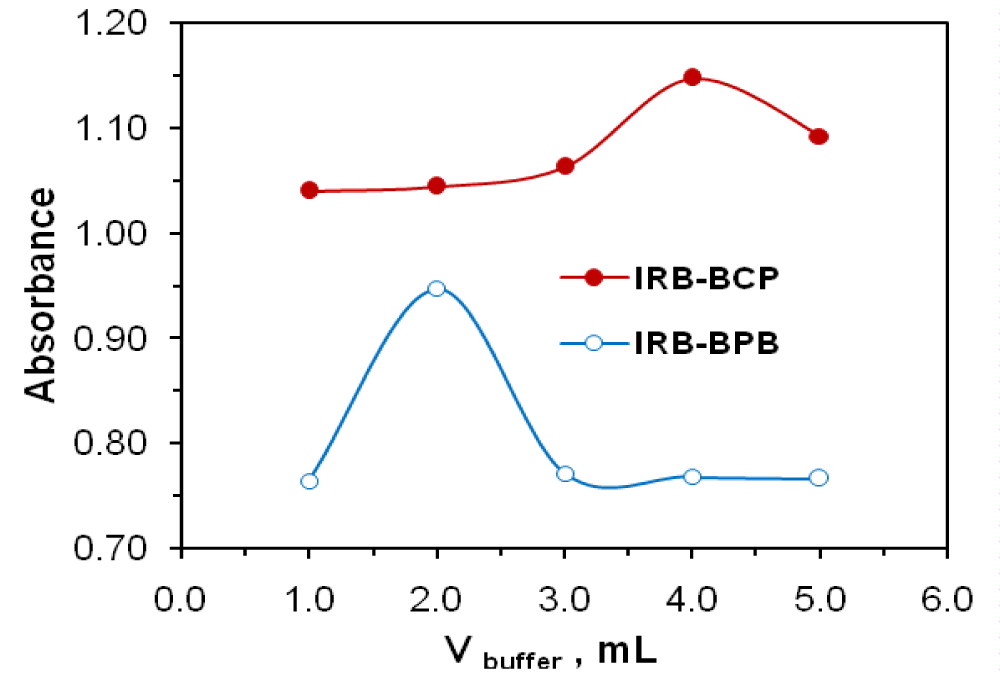
Figure 3: Effect of buffer volume on absorbance at λmax of IRB (22.5 µg mL-1)−BPB (0.5 M) at pH 2 and IRB (25 µg mL-1)−BCP (0.6 M) at pH 1.6.
The optimum reaction time was investigated by following the color development at ambient temperature (25 ± 2 °C). Complete color intensity was attained after 2 min of mixing for all complexes. The effect of several organic solvents was studied for the effective extraction of the colored ion-pair complexes from the aqueous phase. Chloroform was found to be the most suitable solvent for the extraction of complexes quantitatively. The extraction with 10 mL chloroform, yields maximum absorbance intensity and considerably lower extraction ability for the reagent blank and the shortest time to reach the equilibrium between both phases.
The effect of the reagent concentration was studied by measuring the absorbance of solutions containing a fixed concentration of IRB drug and varying amounts of the respective reagents. The maximum color intensity of the complex was achieved with 5.0 mL or 6.0 mL of 1.0×10⁻³ M BPB or BCP, reagent solutions, respectively. The effect of the reagent’s concentration on the absorbance is shown in Figure 4. A larger volume of the reagent had no pronounced effect on the absorbance of the formed ion-pair complex.
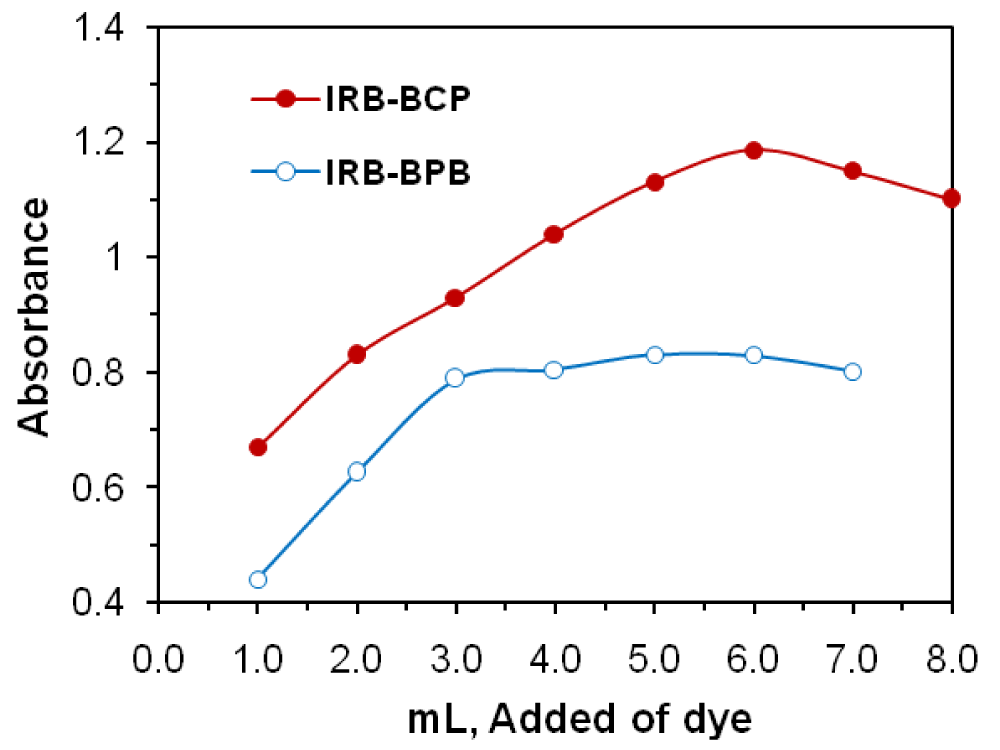
Figure 4: Reagent effect on the formation of IRB (19 µg mL-1)−BPB and IRB (25 µg mL-1)−BCP.
The results of the reaction stoichiometry between IRB and dye revealed that the formation of ion-pair complexes IRB−BCP and IRB−BPB followed a ratio of 1:1 (Figures 5,6).
Since changing pH has no effect on the spectral contribution of HSA, these spectra indicate a gradual increase of the dihedral angle between the half-curcumin chromophores. A molecular model characterizes the conformation curcumin adopts at high pH (Figure 5).
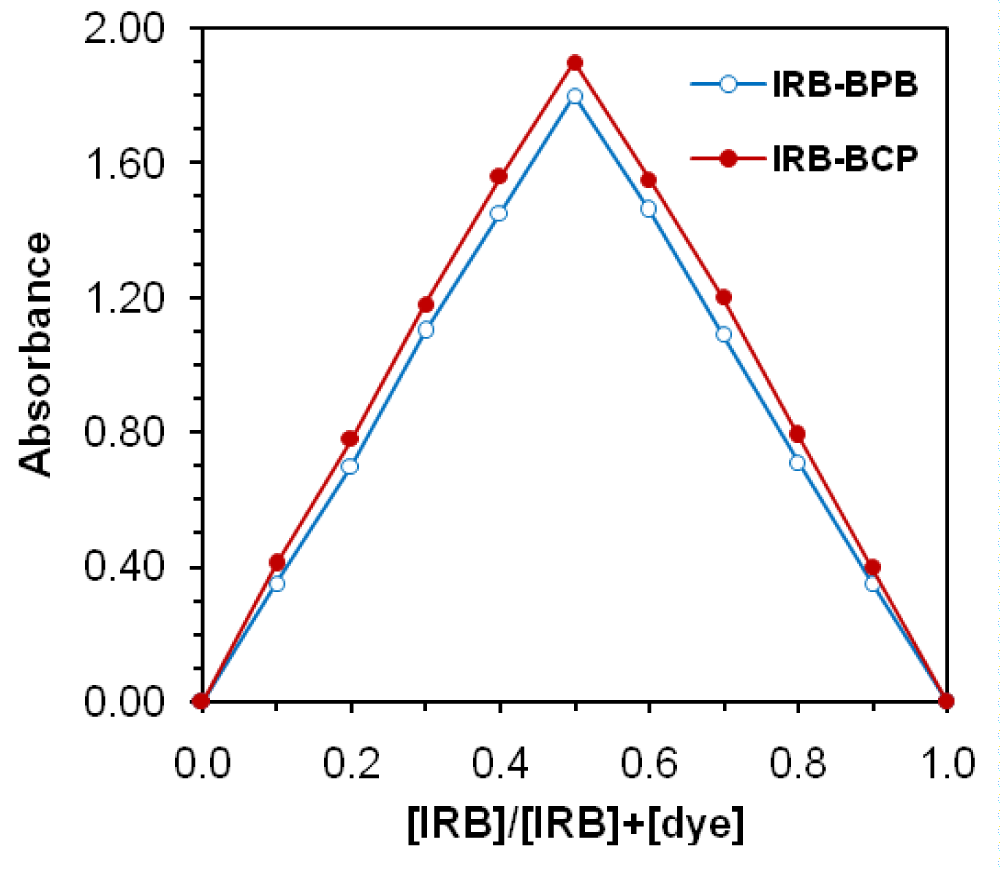
Figure 5: Job’s method of continuous variations of IRB-dye complexes, CIRB+Cdye =2×10⁻⁴ M.
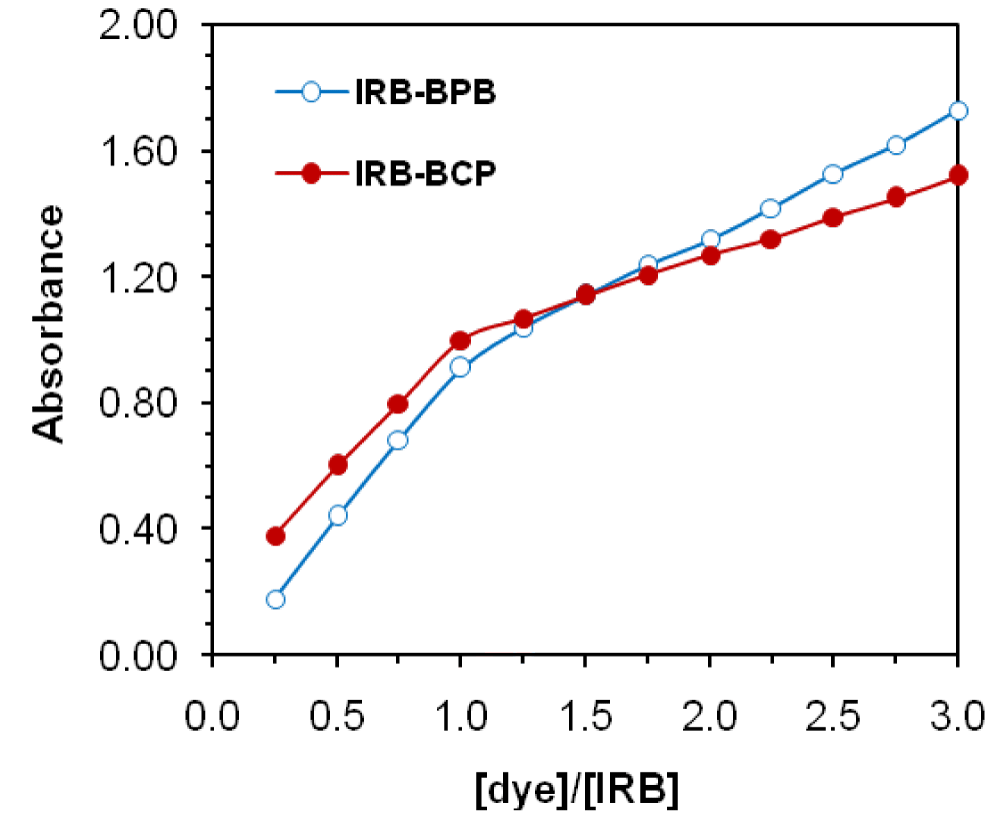
Figure 6: Mole-ratio method of IRB-dye ion-pair complexes, (CIRB=5×10⁻⁵ M for BPB and BCP).
The stability constant (Kf) value of IRB complexes with BPB and BCP was determined by substituting the data of continuous variation in the equation (1) derived for calculating the stability constant spectrophotometrically.
(1)
where A is the maximum observed absorbance and Am is the absorbance value when all the amount of drug is associated. CM is the mole concentration of the drug at the maximum absorbance and n is the combination ratio of the ion-pair considered [39]. The log Kf values obtained for the IRB-BPB and IRB-BCP ion-pair are 6.00 and 6.39, respectively.
The standard free energy of the reaction product is related to the association or the formation constant by the equation (2), which was used to calculate ∆Go [43]:
∆G◦ = −2.303 RT log K (2)
where ∆G◦ is the free energy change of the complex, R is the gas constant 8.314 J k-1 mol-1, T is the temperature in Kelvin (k), and K is the formation constant of drug–the reagent complex. The value of Gibbs free energy (∆G‡) of activation of the reaction product was determined using equation 2, and its value was −34.24 and −36.46 KJ mol-1 for IRB−BPB and IRB−BCP, respectively. The negative value of the calculated free energy (ΔG‡) indicates the stability of the complex and its spontaneous formation.
Containing cationic nitrogen, IRB drug reacts with BPB or BCP in Britton buffer to form an ion-pair complex between the basic nitrogen of IRB and dye. Each IRB–dye complex, with two oppositely charged ions, behaves as a single unit held together by an electrostatic force of attraction (Scheme 1).
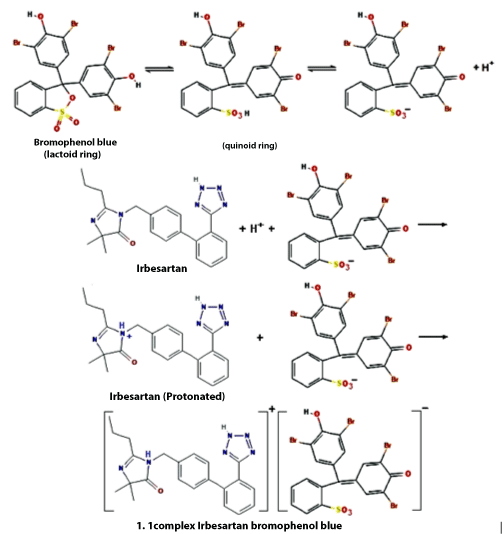
Scheme 1: The possible reaction mechanisms.
The formed complex is extracted into chloroform quantitatively.
Validation of the proposed methods
Graph of absorbance versus concentration is described by regression equation obtained according to the least-squares method [44]. A linear relationship was found between the absorbance at λmax and the concentration of IRB in the range 1.8-45.0 and 1.5-43.0 µg mL-1 for BPB and BCP method, respectively, in the final measured volume of 10 mL. Beer’s law plots at λmax showed an excellent correlation with negligible intercept. Ringbom optimum concentration range was calculated for more accurate analysis [45]. Table 1 represents the analytical parameters for the evaluation of IRB by the developed methods. The high molar absorptivity of the resulting colored complex indicates the high sensitivity of the method. The sensitivity of the method was determined by the limit of detection (LOD) and limit of quantification (LOQ). The LOD and LOQ of IRB were calculated experimentally by the following equations: LOD(𝑘=3.3) = 𝑘×𝑆𝑎/𝑏 and LOQ(𝑘=10) = 𝑘×𝑆𝑎/𝑏 [46] (where 𝑏 is the slope of the calibration curve and 𝑆�� is the standard deviation of the intercept) and given in Table 1.
Table 1: Analytical parameters for the evaluation of IRB by the developed methods. |
||
Parameters |
Extraction method with |
|
| BPB | BCP | |
| lmax (nm) | 420 | 420 |
| log Kf | 6.00 | 6.39 |
| Stability (hrs) | 72 | 48 |
| Beer’s law limit (µg mL-1) | 1.8-45.0 | 1.5-43.0 |
| Ringbom limit (µg mL-1) | 4.0-28.0 | 4.0-24.0 |
| LOD (µg mL-1) | 0.040 | 0.080 |
| LOQ (µg mL-1) | 0.12 | 0.244 |
| Ɛ (L mol-1 cm-1) | 1.9´104 | 2.3´104 |
| Sandell's sensitivity, µg cm-2 | 0.045 | 0.037 |
| Regression equation A=mC+b* | ||
| Slope (m) | 0.0430 |
0.0424 |
| Intercept (b) | 0.0057 | 0.0925 |
| Correlation coefficient (r ) | 0.9999 | 0.9998 |
| DG‡ (KJ mol-1) | −34.24 | −36.46 |
| Range of error % | ± 1.62 | ± 0.44 |
| *With respect to A=mC+b, where A is absorbance and C is the concentration (µg mL-1). | ||
The precision was determined by repeatability (intraday precision) and intermediate precision (interday precision). Repeatability was estimated by using different levels of drug concentrations (same concentration levels taken in the accuracy study) and analyzed, during the same day (n = 6), under the same experimental conditions. The intermediate precision was studied by comparing the results obtained on three different days (Table 2). The low values of RSD% indicate good precision and reproducibility of the methods. Accuracy was evaluated as percentage recovery for IRB. The average percent recoveries obtained were quantitative, indicating good accuracy of the methods.
| Table 2:Analysis of IRB in bulk powder by the proposed methods. | |||||||
| Method | Drug taken (mg mL-1) | Intra-day (n = 6) | Inter-day (n = 6) | ||||
| Found ± SD (mg mL-1) | RSD % | Recovery % | Found ± SD (mg mL-1) | RSD % | Recovery % | ||
| BPB | 1.80 | 1.83 ± 0.04 | 2.18 | 101.67 | 1.82 ± 0.03 | 1.65 | 101.11 |
| 5.00 | 5.07 ± 0.10 | 1.97 | 101.40 | 5.05 ± 0.08 | 1.58 | 101.00 | |
| 10.00 | 10.13 ± 0.17 | 1.67 | 101.30 | 10.08 ± 0.14 | 1.39 | 100.80 | |
| 20.00 | 20.13 ± 0.14 | 0.69 | 100.65 | 20.04 ± 0.12 | 0.60 | 100.20 | |
| 40.00 | 40.04 ± 0.22 | 0.55 | 100.10 | 40.05 ± 0.21 | 0.52 | 100.12 | |
| BCP | 1.50 | 1.49 ± 0.03 | 2.01 | 99.33 | 1.51 ± 0.04 | 2.65 | 100.66 |
| 5.00 | 5.02 ± 0.09 | 1.79 | 100.40 | 5.04 ± 0.10 | 1.98 | 100.80 | |
| 10.00 | 10.03 ± 0.14 | 1.39 | 100.30 | 10.06 ± 0.15 | 1.49 | 100.60 | |
| 20.00 | 20.04 ± 0.18 | 0.89 | 100.20 | 20.07 ± 0.20 | 0.99 | 100.35 | |
| 40.00 | 40.02 ± 0.27 | 0.67 | 100.05 | 40.04 ± 0.23 | 0.57 | 100.10 | |
| The RSD% and Recovery% criteria are ± 5%. | |||||||
The proposed methods were found to be selective for the determination of IRB in the presence of various tablet excipients. The recoveries were not affected by the excipients and the excipients blend did not show any absorption in the range of analysis.
The robustness of an analytical procedure is a measure of its capacity to remain unaffected by small, but deliberate variations in method parameters and provides an indication of its reliability during normal usage. The method’s robustness was examined by evaluating the influence of a small variation of method variables, using five replicates at an IRB concentration level of 25 µg mL-1. Some parameters were interchanged: dye volume ( ± 0.1 mL), pH ( ± 0.1), and shaking time ( ± 1.0 min). The capacity remained unaffected by small deliberate variations and then the method is robust (Table 3).
| Table 3: Results of robustness study of IRB. | ||||
| Parameter variation | Recovery % ± SD (n = 5) | |||
| BPB | BCP | |||
| No Change | - | 100.14 ± 0.10 | - | 100.09 ± 0.12 |
| Dye volume ( ± 0.1 mL) | 4.9 mL | 100.02 ± 0.14 | 5.9 mL | 99.71 ± 0.12 |
| 5.1 mL | 100.04 ± 0.12 | 6.1 mL | 99.31 ± 0.14 | |
| Buffer volume ( ± 0.1 mL) | 1.9 mL | 99.84 ± 0.13 | 3.9 mL | 99.43 ± 0.21 |
| 2.1 mL | 99.45 ± 0.14 | 4.1 mL | 99.20 ± 0.23 | |
| pH value ( ± 0.1 mL) | 1.9 | 99.38 ± 0.12 | 1.5 | 99.39 ± 0.17 |
| 2.1 | 99.42 ± 0.11 | 1.7 | 99.23 ± 0.13 | |
| Shaking time ( ± 1.0 min) | 1.0 min | 100.09 ± 0.12 | 1.0 min | 100.04 ± 0.14 |
| 3.0 min | 100.13 ± 0.13 | 3.0 min | 100.10 ± 0.13 | |
Application to the pharmaceutical dosage forms
Various irbesartan pharmaceutical preparations were analyzed to assess the applicability of the developed methods for assaying IRB in tablets and the results obtained were compared with those of the official method [1], as shown in Table 4. This comparison showed that the results are statistically identical, as there are no statistically significant differences in accuracy and precision between the developed and the official methods, as evidenced by the t-value and variance ratio F - value at a 95% confidence level for five degrees of freedom. The ingredients in the tablets did not interfere with the trials.
| Table 4: Determination of IRB in tablets by the developed and official methods. | |||
| Sample | Official method (n=4) [1] | Proposed methods, Recovery a ± SD% | |
| BPB | BCP | ||
| Aprovel (150 mg IRB/tab) |
100.28 ± 0.33 | 101.17 ± 0.86 | 100.77 ± 0.65 |
| t =1.78 | t =1.58 | t =1.62 | |
| F =1.27 | F =1.29 | ||
| Rovil (150 mg IRB/tab) |
101.03 ± 0.52 | 100.30 ± 0.74 | 100.22 ± 0.61 |
| t =1.84 | t =1.46 | t =1.39 | |
| F =1.59 | F =1.75 | ||
| a Average of five determinations. At a 95% confidence limit, the theoretical t and F-values at four degrees of freedom are t = 2.776 and F =6.26. | |||
The developed extractive spectrophotometric methods describe the use of BPB and BCP acid dyes for the estimation of irbesartan in bulk and tablets. The reagents utilized in the proposed methods are cheaper and readily available; the procedures do not involve any critical reaction conditions and tedious sample preparation. The proposed methods are simple, accurate, precise, rapid, and sufficiently sensitive to permit determination even down to 40 ng mL-1, which is higher than what is available in references for similar methods [38,39]. Although the high-performance liquid chromatographic methods have a higher selectivity, they require complicated sample pretreatment and use expensive apparatus. Moreover, the proposed methods have the advantages of inexpensive analytical reagents, available in any analytical laboratory along with the lower reagents consumption leads to an environmentally friendly spectrophotometric procedure, which makes it especially suitable for routine quality control analysis work. Those modalities had an excellent agreement of sample recovery from all formulations with their respective label claims, indicating that the excipients of the formulations did not overlap with the estimation.
- British Pharmacopœia, Her Majesty Stationery Officer, London, UK, 2013.
- Cazaubon C, Gougat J, Bousquet F, Guiraudou P, Gayraud R, Lacour C, Roccon A, Galindo G, Barthelemy G, Gautret B, Bernhart C, Perreaut P, Breliere JC, LeFur G, Nisto D, Pharmacological characterization of SR47436, a new nonpeptide AT1 subtype angiotensin II receptor antagonist. J Pharmacol Exp Ther 265(2), 1993, 826–834.ISSN 1521-0103
- United States Pharmacopoeial Convention Inc. Rockville, 2011.
- Rahman N, Siddiqui MR, Azmi SN. Quantitative analysis of irbesartan in commercial dosage forms by kinetic spectrophotometry. Chem Pharm Bull (Tokyo). 2006 May;54(5):626-31. doi: 10.1248/cpb.54.626. PMID: 16651756.
- Ashour S, Bayram R, Selective and validated kinetic spectrophotometric method for the determination of irbesartan in pure and pharmaceutical formulations, Annales Pharmaceutiques Françaises, 77(2), 2019, 101–111. https://doi.org/10.1016/j.pharma.2018.09.002
- El-Shaboury SR, Hussein SA, Mohamed NA, El-Sutohy MM. Spectrofluorimetric method for determination of some angiotensin II receptor antagonists. J Pharm Anal. 2012 Feb;2(1):12-18. doi: 10.1016/j.jpha.2011.10.005. Epub 2011 Nov 10. PMID: 29403715; PMCID: PMC5760827.
- El-Bagary RI, Hashem HM, Waleed A, Ebeid WA, Spectrofluorometric, spectrophotometric and LC determination of irbesartan. Journal of Chemical and Pharmaceutical Research, 3(4), 2011, 722–733. https://www.jocpr.com/articles/septrofluorometric-spectrophotometric-and-lc-determination-of-irbesartan.pdf. ISSN No: 0975-7384.
- Ganesh K, Balraj C, Elango KP. Spectroscopic and spectrofluorimetric studies on the interaction of irbesartan with 2,3-dichloro-5,6-dicyano-1,4-benzoquinone and iodine. Spectrochim Acta A Mol Biomol Spectrosc. 2011 Sep;79(5):1621-9. doi: 10.1016/j.saa.2011.05.022. PMID: 21684193.
- Kulsum S, Padmalatha M, Kumar E, Sruthi M, Vidyasagar G, Spectrophotometric methods for the determination of irbesartan in pure and pharmaceutical dosage forms. Research Journal of Pharmacy and Technology, 2011, 4(10), 1567–1569.
- Nissankararao S, Anil Kumar A, Bhimavarapu RD, Krishna Prasanna V, Estimation of irbesartan in bulk and dosage forms by new simple UV spectrophotometry using hydrotropic technique. Pharmaceutica Analytica Acta. 2013, 4(8): 8–10. https://doi.org/10.4172/2153-2435.1000265
- Li JM, Wu Q, Wang LL, Assay of irbesartan tablets by HPLC. Chinese Journal of Pharmaceutical Analysis, 2001, 21(4), 249–250.
- Goswami N. A validated stability-indicating liquid chromatographic method for determination of process related impurities and degradation behavior of Irbesartan in solid oral dosage. J Adv Pharm Technol Res. 2014 Jan;5(1):33-40. doi: 10.4103/2231-4040.126985. PMID: 24695518; PMCID: PMC3960792.
- Ganesan M, Nanjundan S, Gomathi M, Muralidharan S, Method development and validation of Irbesartan using LCMS/MS: Application to pharmacokinetic studies. Journal of Chemical and Pharmaceutical Research, 2(4), 2010, 740–746. ISSN No: 0975-7384
- Praveen Kumar M, Sreeramulu J, Development and validation of a stability-indicating RP-HPLC method for assay of irbesartan in pure and pharmaceutical dosage form. International Journal of Pharmaceutical Sciences Review and Research, 6(10), 2011, 94–99. ISSN 0976 – 044X
- Sane RT, Francis M, Pawar S, Determination of irbesartan in pharmaceutical dosage forms by HPTLC. Indian Drugs, 2002, 39(1), 32–35.
- Patil SH, Janjale MV. Novel and validated titrimetric method for determination of selected angiotensin-II-receptor antagonists in pharmaceutical preparations and its comparison with UV spectrophotometric determination. J Pharm Anal. 2012 Dec;2(6):470-477. doi: 10.1016/j.jpha.2012.03.009. Epub 2012 Apr 9. PMID: 29403786; PMCID: PMC5760927.
- Gupta VK, Jain R, Agarwal S, Mishra R, Dwivedi A. Electrochemical determination of antihypertensive drug irbesartan in pharmaceuticals. Anal Biochem. 2011 Mar 15;410(2):266-71. doi: 10.1016/j.ab.2010.11.024. Epub 2010 Nov 19. PMID: 21094117.
- Vetuschi C, Giannandrea A, Carlucci G, Mazzeo P. Determination of hydrochlorothiazide and irbesartan in pharmaceuticals by fourth-order UV derivative spectrophotometry. Farmaco. 2005 Aug;60(8):665-70. doi: 10.1016/j.farmac.2005.04.013. PMID: 15963513.
- Joseph Charles J, Brault S, Boyer C, Langlois MH, Cabrero L, Dubost JP, Simultaneous determination of irbesartan and hydrochlorothiazide in tablets by derivative spectrophotometry, Analytical Letters, 36(11), 2003, 2485–2495. https://doi.org/10.1081/AL-120024337
- Erk N. Three new spectrophotometric methods applied to the simultaneous determination of hydrochlorothiazide and irbesartan. Pharmazie. 2003 Aug;58(8):543-8. PMID: 12967029.
- Albero I, Ródenas V, García S, Sánchez-Pedreño C. Determination of irbesartan in the presence of hydrochlorothiazide by derivative spectrophotometry. J Pharm Biomed Anal. 2002 Jun 20;29(1-2):299-305. doi: 10.1016/s0731-7085(02)00073-0. PMID: 12062690.
- Sivasubramanian L, Lakshmi KS, Spectrophotometric multicomponent analysis of irbesartan, hydrochlorothiazide and ramipril in pharmaceutical formulations by chemometric techniques. Journal of Analytical & Pharmaceutical Research 2(3), 2016, 1–10. DOI: 10.15406/japlr.2016.02.00019
- Üstündağ Ö, Dinç E, Simultaneous quantitative resolution and validation of a binary mixture in a pharmaceutical dosage form by using a spectrophotometric signal processing technique. J. Fac. Pharm. Ankara, 44(3), 2020, 506–516. Doi: 10.33483/jfpau.799897
- Abdel Monem Hegazy M, Fayez YM. Mean centering of ratio spectra and concentration augmented classical least squares in a comparative approach for quantitation of spectrally overlapped bands of antihypertensives in formulations. Spectrochim Acta A Mol Biomol Spectrosc. 2015 Apr 5;140:210-5. doi: 10.1016/j.saa.2014.12.103. Epub 2015 Jan 5. PMID: 25594214.
- Fayez YM. Simultaneous determination of some anti-hypertensive drugs in their binary mixture by novel spectrophotometric methods. Spectrochim Acta A Mol Biomol Spectrosc. 2014 Nov 11;132:446-51. doi: 10.1016/j.saa.2014.04.102. Epub 2014 Apr 30. PMID: 24887506.
- Lakshmi S, Lakshmi KS, H-point standard addition method for simultaneous spectrophotometric determination of irbesartan, hydrochlorothiazide and telmisartan in tablets. International J. Res. Pharm. Chem. 4(2), 2014, 373–380. ISSN: 2231-2781
- Hillaert S, Van den Bossche W. Simultaneous determination of hydrochlorothiazide and several angiotensin-II-receptor antagonists by capillary electrophoresis. J Pharm Biomed Anal. 2003 Feb 26;31(2):329-39. doi: 10.1016/s0731-7085(02)00643-x. PMID: 12609672.
- Hillaert S, Van den Bossche W. Optimization and validation of a capillary zone electrophoretic method for the analysis of several angiotensin-II-receptor antagonists. J Chromatogr A. 2002 Dec 6;979(1-2):323-33. doi: 10.1016/s0021-9673(02)01247-5. PMID: 12498264.
- Alanazi AM, Abdelhameed AS, Khalil NY, Khan AA, Darwish IA, HPLC method with monolithic column for simultaneous determination of irbesartan and hydrochlorothiazide in tablets. Acta Pharmaceutica, 2014, 64(2), 187–198. https://doi.org/10.2478/acph-2014-0014
- Rane VP, Patil KR, Sangshetti JN, Yeole RD, Shinde DB. Stability indicating LC method for simultaneous determination of irbesartan and hydrochlorothiazide in pharmaceutical preparations. J Chromatogr Sci. 2010 Aug;48(7):595-600. doi: 10.1093/chromsci/48.7.595. PMID: 20819286.
- Vujić Z, Mulavdić N, Smajić M, Brborić J, Stankovic P. Simultaneous analysis of irbesartan and hydrochlorothiazide: an improved HPLC method with the aid of a chemometric protocol. Molecules. 2012 Mar 16;17(3):3461-74. doi: 10.3390/molecules17033461. PMID: 22426527; PMCID: PMC6268177.
- Koyuturk S, Can NO, Atkosar Z, Arli G. A novel dilute and shoot HPLC assay method for quantification of irbesartan and hydrochlorothiazide in combination tablets and urine using second generation C18-bonded monolithic silica column with double gradient elution. J Pharm Biomed Anal. 2014 Aug;97:103-10. doi: 10.1016/j.jpba.2014.04.026. Epub 2014 May 2. PMID: 24876066.
- KurbanoĞlu S, Yarman A. Simultaneous Determination of Hydrochlorothiazide and Irbesartan from Pharmaceutical Dosage Forms with RP-HPLC. Turk J Pharm Sci. 2020 Oct;17(5):523-527. doi: 10.4274/tjps.galenos.2019.76094. Epub 2020 Oct 30. PMID: 33177933; PMCID: PMC7650730.
- Ibrahim AE, Elmansi H, Belal F. Solvent-free mixed micellar mobile phases: An advanced green chemistry approach for reversed-phase HPLC determination of some antihypertensive drugs. J Sep Sci. 2020 Aug;43(16):3224-3232. doi: 10.1002/jssc.202000429. Epub 2020 Jun 23. PMID: 32510825.
- Ali TA, Mohamed GG, Aglan AA, Heakal FE, RP-HPLC stability-indicating method for estimation of irbesartan and hydrochlorothiazide in bulk and pharmaceutical dosage form. Chinese Journal of Analytical Chemistry, 44(1), 2016, e1601–e1608. https://doi.org/10.1016/S1872-2040(16)60899-X
- Zаrеh MM, Sааd MZ, Hаssаn WS, Еlhеnnаwу MЕ, Soltan MK, Sеbаiу MM. Grаdiеnt HPLC Mеthоd fоr Simultаnеоus Dеtеrminаtiоn оf Еight Sаrtаn аnd Stаtin Drugs in Thеir Purе аnd Dоsаgе Fоrms. Pharmaceuticals (Basel). 2020 Feb 20;13(2):32. doi: 10.3390/ph13020032. PMID: 32093384; PMCID: PMC7169415.
- Alhazmi HA, Alnami AM, Arishi MAA, Alameer RK, Al Bratty M, Rehman ZU, Javed SA, Arbab IA. A Fast and Validated Reversed-Phase HPLC Method for Simultaneous Determination of Simvastatin, Atorvastatin, Telmisartan and Irbesartan in Bulk Drugs and Tablet Formulations. Sci Pharm. 2017 Dec 19;86(1):1. doi: 10.3390/scipharm86010001. PMID: 29257120; PMCID: PMC5874531.
- Abdellatef HE. Extractive-spectrophotometric determination of disopyramide and irbesartan in their pharmaceutical formulation. Spectrochim Acta A Mol Biomol Spectrosc. 2007 Apr;66(4-5):1248-54. doi: 10.1016/j.saa.2006.06.015. Epub 2006 Jun 27. PMID: 16920393.
- Ashour S, Bayram R, Sensitive extractional colorimetric analysis of fexofenadine hydrochloride and irbesartan bases through acid-dye complexation using naphthol blue black in pure form and pharmaceuticals, Modern Chemistry, 2017, 5(6), 93–100. http:/doi=10.11648/j.mc.20170506.12
- Ashour S, Chehna MF, Bayram R. Spectrophotometric Determination of Alfuzosin HCl in Pharmaceutical Formulations with some Sulphonephthalein Dyes. Int J Biomed Sci. 2006 Sep;2(3):273-8. PMID: 23674990; PMCID: PMC3614605.
- Ashour S, Al-Khalil R. Simple extractive colorimetric determination of levofloxacin by acid-dye complexation methods in pharmaceutical preparations. Farmaco. 2005 Sep;60(9):771-5. doi: 10.1016/j.farmac.2005.06.007. PMID: 16023643.
- Rose J, Advanced physico-chemical experiments, Pittman, London, 1964, 67.
- Martin AN, Swarbrick J, Cammarata A. Physical Pharmacy. Third Edition, Lee and Febiger, Philadelphia, 1983, 344–346.
- Miller JN, Miller JC, Statistics and Chemometrics For Analytical Chemistry, Chapman & Hall/CRC, London, UK, 5th edition, 2005.
- Ringbom A, Zeitschrift Analytische Chemie, 1939, pp. 115–332.
- Long GL, Winefordner JD. Limit of Detection. A Closer Look at the IUPAC Definition, Anal. Chem. 1983, 55(7), 712A–724A. https://doi.org/10.1021/ac00258a724