
More Information
Submitted: July 15, 2026 | Accepted: July 23, 2026 | Published: July 24, 2026
Citation: Udoubom IA, Etim OE, Ndem JI, Akpan AA, Agu GE, Jonah UI, et al. Sequence-dependent Modulation of Hepatorenal Biochemical Markers Following Artemether–lumefantrine and Sulfadoxine–pyrimethamine Exposure in Wistar Rats. Arch Pharm Pharma Sci. 2026; 10(1): 21-28. Available from:
https://dx.doi.org/10.29328/journal.apps.1001072
DOI: 10.29328/journal.apps.1001072
Copyright license: © 2026 Udoubom IA, et al, et al. This is an open access article distributed under the Creative Commons Attribution License, which permits unrestricted use, distribution, and reproduction inany medium, provided the original work is properly cited.
Keywords: Artemether–Lumefantrine; Sulfadoxine–Pyrimethamine; Sequential therapy; Hepatorenal stress; Hepatorenal biomarkers; Biochemical alterations; Organ stress biomarkers; Wistar rats; Antimalarial chemotherapy; Liver enzymes; Kidney function; Sequence-dependent effects; Early organ stress

Sequence-dependent Modulation of Hepatorenal Biochemical Markers Following Artemether–lumefantrine and Sulfadoxine–pyrimethamine Exposure in Wistar Rats
Inimfon A Udoubom1, Oboso E Etim2, Jessie I Ndem2, Anietie A Akpan3, Grace E Agu4, Ubokutomabasi I Jonah1, Ekpono-Abasi U James5 and Ineza Patrick6*
1Department of Biochemistry, University of Uyo, Uyo, Nigeria
2Department of Biochemistry, University of Calabar, Calabar, Nigeria
3Department of Medicine and Surgery, University of Nigeria, Enugu, Nigeria
4Michael Okpara University of Agriculture, Umudike, Nigeria
5Faculty of Pharmacy, University of Uyo, Nigeria
6Laboratory Services Department, Rwanda Food and Drugs Authority, Nigeria
*Corresponding author: Ineza Patrick, Laboratory Services Department, Rwanda Food and Drugs Authority, Nigeria, Email: [email protected]
Malaria remains one of the most pressing public health challenges, particularly in Sub-Saharan Africa. Antimalarial drugs used in its treatment may influence biochemical markers of hepatic, renal, and metabolic function. This study aimed to evaluate the toxicological effects of the sequential administration of artemether-lumefantrine and sulfadoxine-pyrimethamine in male Wistar rats. Thirty (30) mature male Albino Wistar rats weighing between 190- 280 g were randomly divided into five groups comprising six (6) rats each. Group 1 served as control, Group 2 received Artemether-lumefantrine (8 mg/kg/bw) for 3 days, Group 3 received sulfadoxine-pyrimethamine (0.079 mg/kg/bw) for 1 day, Group 4 received a sequential dose of Artemether-Lumefantrine for 3 days and sulfadoxine-pyrimethamine for 1 day, while Group 5 received a sequential dose of SP for 1 day and AL for 3 days. Sequential administration of AL and SP resulted in a significant (p < 0.05) elevation of ALT, AST, ALP, serum total and direct bilirubin levels, urea, creatinine, and HDL. There was a significant (p < 0.05) decrease in the serum total protein and albumin. Notably, HDL levels increased significantly in the SP → AL group (p < 0.05), while other lipid parameters showed sequence-specific significant changes compared to the control. Sequential administration, particularly the SP → AL sequence, was observed to have more pronounced effects on hepatorenal biomarkers compared to independent administration. These findings provide preliminary evidence that the sequence of administration may influence hepatorenal biochemical responses following exposure to these antimalarial drugs.
Malaria is one of the most devastating infectious diseases with an annual global burden of over 200 million, alongside hundreds of thousands of deaths reported each year and approximately 95% occurring in the WHO African Region [1,2]. It is a protozoan disease transmitted by Anopheles female mosquitoes and results from the infection of a vulnerable host by Plasmodium parasites, of which over 120 species are known, with only five (P. falciparum, P. vivax, P. malariae, P. ovale, P. knowlesi) causing malarial infections in humans. Mortality is predominantly attributed to infection with P. falciparum, and P. vivax, heretofore associated with uncomplicated malaria, has recently been documented as a causative agent of severe human infection [3]. In 2024, it is estimated that there were 282 million cases of malaria in 80 endemic countries, an increase of 9 million cases from 2023, and this is determined by various complex factors, including population growth, conflict, climate events, and health system disruptions [4].
The primary impediment to successful malaria treatment is the proliferation of parasite resistance to antimalarial drugs in Africa. Consequently, the World Health Organisation (WHO) recommended that antimalarial therapies be deployed as combination therapies (CTs) rather than the usual monotherapies [5]. Coartem®, an artemisinin combination therapy containing Artemether-Lumefantrine (AL), is the first-line drug recommended for the treatment of acute and complicated malaria fever in patients with a minimum body weight of 5 kg, and it is widely used across malaria-endemic regions [6]. Clinical trials showed that Coartem® is effective, safe, and well-tolerated against multidrug-resistant Plasmodium falciparum [7]. Artemisinin derivatives rapidly reduce parasite biomass, achieving up to a 10,000-fold reduction per asexual cycle [8].
Despite the scale-up of antimalarial interventions and the resultant reduction in malaria transmission in some areas, the morbidity and mortality of malaria disease are still high in several areas of sub-Saharan Africa [9]. Artemether–Lumefantrine and Sulfadoxine–Pyrimethamine (SP) are both recommended by the WHO and have contributed to reductions in malaria-related morbidity and mortality in different populations [10,11]. Artemisinin-based combination therapies (ACTs) combine a fast-acting artemisinin derivative with a long-acting drug to prevent recrudescence and drug resistance [5]. The emergence of antimalarial drug resistance has led various countries in sub-Saharan Africa to adopt the World Health Organisation (WHO) recommended artemisinin-based combination therapy for treatment of uncomplicated P. falciparum malaria [7]. In routine clinical practice, treatment failure, self-medication, drug switching, and mass drug administration programs may result in the independent or sequential use of different antimalarial agents. However, the biochemical consequences of their sequential administration, particularly the effect of drug order, are still not well understood.
The liver is the most sensitive predictor of chemical-induced toxicity because of its involvement in metabolism, detoxification, and storage of drugs and their metabolites. It is an important target organ for drug-induced injury in mammals. The leakage of cytosolic enzymes such as alanine aminotransferase (ALT), aspartate aminotransferase (AST), and alkaline phosphatase (ALP) is closely related to the distortion of hepatocyte membrane integrity [12]. These enzymes are commonly used as markers of hepatocellular stress. The kidney is affected because of its significant role in drug elimination and maintaining metabolic balance. Changes in serum urea and creatinine levels are used as early markers of kidney function impairment. These modulations can be detected before any histopathological changes in the kidney, making them markers of functional organ stress [13].
Artemisinin derivatives such as artemether are metabolised in the liver by cytochrome P450 enzymes. These drugs have been shown to modulate enzyme activity through induction mechanisms [14]. Modulation of drug metabolism dynamics by sequential exposure to antimalarial drugs may alter drug clearance, leading to the accumulation of reactive metabolites. This can affect drug-metabolising pathways, leading to different effects in the liver and kidneys depending on the sequence of drug administration [15].
Considering the widespread use of Artemether–Lumefantrine and Sulfadoxine–Pyrimethamine and the likelihood of their sequential administration in malaria-endemic regions, it is therefore pertinent to evaluate the biochemical consequences of such exposure, especially early biochemical indicators of hepatorenal stress. Therefore, the objective of this study was to ascertain sequence-specific variations in hepatic and renal biochemical markers following independent and sequential administration of Artemether–Lumefantrine and Sulfadoxine–Pyrimethamine in Wistar rats.
Experimental animals
Thirty male albino Wistar rats weighing 190- 280 g were procured from the Department of Zoology Animal House, Faculty of Science, University of Uyo (UNIUYO), Akwa Ibom State. The animals were weighed, labelled, and kept in cages at the Animal House, Faculty of Basic Medical Sciences (FBMS), UNIUYO, Akwa Ibom State, Nigeria. The rats were acclimatised in an optimum pathogen-free environment and maintained a 12-hour light/dark cycle (light on at 6:00 a.m.) at 25-27 °C for 2 weeks before the start of the experiment, to allow free and unhindered access to diet and water. The animals were separated into cages with dimensions of 23 cm in length, 10.3 cm in width, and 13 cm in height. The cages were properly maintained by changing the sawdust and leftover feed daily. The rats were fed with rat pellets supplied by Grand Cereals Ltd, Onitsha, Nigeria, and were maintained under standard conditions. Also, the Department of Biochemistry, University of Uyo, Nigeria, Animal Experiment Committee approved the protocol for all animal experiments conducted in this study. All procedures followed the standards established in the NIH Guide for the Care and Use of Laboratory Animals (NIH Publication No. 83-123, revised 1985). The Postgraduate Committee of the Faculty of Basic Medical Sciences at the University of Uyo, Nigeria, approved this study, which received Registration number UU_FBMSREC_2025_002. Efforts were made to reduce the pain caused to the animals and the number of animals required for the study.
Drugs acquisition
Artemether–lumefantrine (AL) was administered using Coartem® tablets (Novartis Pharma AG, Basel, Switzerland). Each tablet contained 80 mg artemether and 480mg lumefantrine as active ingredients. Sulphadoxine-Pyrimethamine tablets were sourced from Somboson Pharmacy, Uyo, Akwa Ibom State, Nigeria (Wapmalar®, Ipca Laboratories, India). Each tablet contained 500mg sulphadoxine and 25mg pyrimethamine as active ingredients.
Experimental design
The adult male Wistar rats were weighed, marked, and divided into five groups of six (6) per group. The study was conducted and reported in accordance with the ARRIVE 2.0 guidelines for animal research. A sample size of six animals per group was selected based on previous toxicological studies employing similar experimental designs and endpoints.
Group 1 served as the control with no drugs administered. Groups 2-5 were administered the following;
Administration of experimental drugs
Artemether–lumefantrine (AL) and sulfadoxine–pyrimethamine (SP) were administered orally as commercially available formulations. AL was administered using Coartem® tablets, each containing 80 mg artemether and 480 mg lumefantrine (560 mg total active ingredients), while SP was administered using Wapmalar® tablets, each containing 500 mg sulfadoxine and 25 mg pyrimethamine (525 mg total active ingredients).
Immediately before administration, tablets were finely crushed using a sterile porcelain mortar and pestle and suspended in freshly prepared distilled water. Because both formulations contain poorly water-soluble active ingredients, the preparations were administered as homogeneous oral suspensions rather than true solutions. Suspensions were continuously vortex-mixed before dosing to ensure uniform dispersion of the active ingredients.
For AL, one tablet containing 560 mg total active ingredients was suspended in 100 mL of distilled water to obtain a stock suspension concentration of 5.6 mg/mL. Appropriate dilutions were prepared from this stock suspension, and animals received AL at a dose of 8 mg/kg body weight. For SP, Wapmalar® tablets containing 500 mg sulfadoxine and 25 mg pyrimethamine per tablet were suspended in distilled water to obtain the required dosing concentration. Animals assigned to SP treatment received a dose of 0.079 mg/kg body weight of the combined sulfadoxine–pyrimethamine formulation. Based on the fixed 20:1 sulfadoxine-to-pyrimethamine ratio, this corresponded to approximately 0.075 mg/kg sulfadoxine and 0.004 mg/kg pyrimethamine.
The volume administered to each animal was calculated individually based on body weight and the concentration of the prepared suspension. All treatments were administered by oral gavage using freshly prepared suspensions. Animals in the sequential-treatment groups received the respective formulations according to the study design, and all dosing procedures were performed under the same experimental conditions.
Animals in Group 4 received AL for three consecutive days followed by a single dose of SP on the fourth day, whereas animals in Group 5 received a single dose of SP followed by AL for three consecutive days. Blood samples were collected 24 hours after the final drug administration.
Animal sacrifice and preparation of sera for analysis
Twenty-four hours after the final drug administration, all animals were anaesthetised by intraperitoneal administration of ketamine. Adequate depth of anaesthesia was confirmed by the absence of the pedal withdrawal reflex, corneal reflex, and response to tail pinch before any procedure was undertaken.
Under deep surgical anaesthesia, whole blood was collected by cardiac puncture using sterile disposable syringes and needles. Following blood collection, the animals were humanely euthanised by exsanguination while remaining under deep anaesthesia, ensuring that recovery from anaesthesia did not occur. All experimental procedures were conducted in accordance with institutional guidelines for the care and use of laboratory animals and were approved by the University of Uyo Faculty of Basic Medical Sciences Research Ethics Committee (Approval No. UU_FBMSREC_2025_002).
Approximately 1 mL of whole blood from each animal was transferred into EDTA-anticoagulated tubes for haematological analysis. The remaining blood was dispensed into plain tubes and allowed to clot undisturbed at room temperature for approximately 2 hours. Samples were subsequently centrifuged at 3,000 rpm for 10 minutes using a bench-top centrifuge (MSE, UK), and the serum was carefully separated using sterile disposable Pasteur pipettes.
Serum samples were visually inspected for evidence of hemolysis, and grossly hemolyzed samples were excluded from biochemical analyses. The separated serum was aliquoted into sterile cryovials and stored at −40°C until analysis. All biochemical analyses were performed within one week of sample collection, and samples were subjected to a single freeze–thaw cycle before analysis to preserve sample integrity.
Biochemical analyses
Serum AST was determined by the Kinetic Method [16], ALT by the colourimetric endpoint method [17], and total and direct bilirubin by Doumas, et al. [18]. Creatinine and urea were assayed spectrophotometrically [19,20]. Serum Potassium, Sodium, and Chloride were measured using an automated ion-selective electrode machine (Lanwing LWE60D, Germany), while bicarbonate was determined spectrophotometrically [16]. Serum Lipid Profile, including triglycerides, total cholesterol, and high-density lipoprotein cholesterol, was assayed using the Fortress Assay Kit. Very low-density lipoprotein cholesterol and Low-density lipoprotein cholesterol were calculated using Friedwald’s formula [21]. Commercial diagnostic kits supplied by Fortress Diagnostics (Antrim, United Kingdom) were used for biochemical analyses according to the manufacturer’s instructions. Assays were calibrated using the kit-provided standards and quality-control materials. All analyses were performed in duplicate. The reported analytical sensitivity, linearity ranges, and intra-assay coefficients of variation were within the specifications provided by the manufacturer. Quality-control samples were included in each analytical batch to ensure assay reliability.
Statistical analyses
Statistical analyses were performed using SPSS version 20.0 (IBM Corp., Armonk, NY, USA). Data were assessed for normality using the Shapiro–Wilk test and for homogeneity of variance using Levene’s test. Comparisons among groups were performed using one-way analysis of variance (ANOVA), followed by Tukey’s multiple-comparison post hoc test where appropriate. Data are presented as mean ± standard error of the mean (SEM). In addition, 95% confidence intervals (95% CI) were calculated for group means using the t-distribution (n = 6 animals per group; df = 5) according to the formula: Mean ± (2.571 × SEM). Statistical significance was accepted at p < 0.05.
Effect on liver function
Results from liver function analyses revealed that sequential treatment with Artemether-Lumefantrine and Sulfadoxine-pyrimethamine significantly (p ˂ 0.05) increased ALT, AST, ALP, and serum total and direct bilirubin levels compared with the control. There were significantly (p < 0.05) decreased levels of serum total protein and albumin following sequential treatment with Artemether-Lumefantrine and Sulfadoxine-pyrimethamine compared with the control, as shown in Table 1 and Figure 1.
| Table 1: Biomarkers of liver function in Wistar rats sequentially treated with Artemether-Lumefantrine and Sulfadoxine-Pyrimethamine. | |||||||
| Groups and Treatment | ALTU/L | ASTU/L | ALP | Total protein g/dL | Albuming/dL | Total bilirubinmg/dL | Direct bilirubinmg/dL |
| Group 1 NC | 40.36 ± 1.54 | 133.58 ± 2.85 | 74.72 ± 2.39 | 80.69 ± 1.96 | 18.52 ± 0.89 | 28.83 ± 0.66 | 3.27 ± 0.41 |
| Group 2 – AL | 41.50 ± 2.39 | 151.82 ± 2.68a | 97.87 ± 3.09a | 70.96 ± 2.16a | 14.62 ± 0.57a | 34.44 ± 0.39a | 4.22 ± 0.52 |
| Group 3 – SP | 40.47 ± 2.13 | 151.13 ± 2.63a | 92.69 ± 4.64a | 66.57 ± 2.24a | 15.58 ± 1.45a | 33.42 ± 0.44a | 6.09 ± 0.17ab |
| Group 4 AL then SP | 56.30 ± 0.99abc | 153.36 ± 2.14a | 108.70 ±1.51abc | 71.94 ± 3.33a | 14.14 ± 0.83a | 33.46 ± 0.37a | 8.11 ± 0.56abc |
| Group 5 –SP then AL | 56.45 ± 1.37abc | 154.54 ± 2.95a | 106.13 ± 2.54ac | 69.62 ± 2.21a | 14.66 ± 0.94a | 34.25 ± 0.53a | 7.09 ± 0.23ab |
| Data presented as Mean ± Standard Error of Mean (SEM). Means of groups were compared and considered significantly different at (p < 0.05). Significant differences are indicated as superscripts defined thus: ‘a’ = significantly different compared with Group 1; ‘b’ = significantly different compared with Group 2; ‘c’ = significantly different compared with Group 3; ‘d’ = significantly different compared with Group 4. NC – Normal Control; AL – Artemether-Lumefantrine; SP – Sulfadoxine-Pyrimethamine. n=6 | |||||||
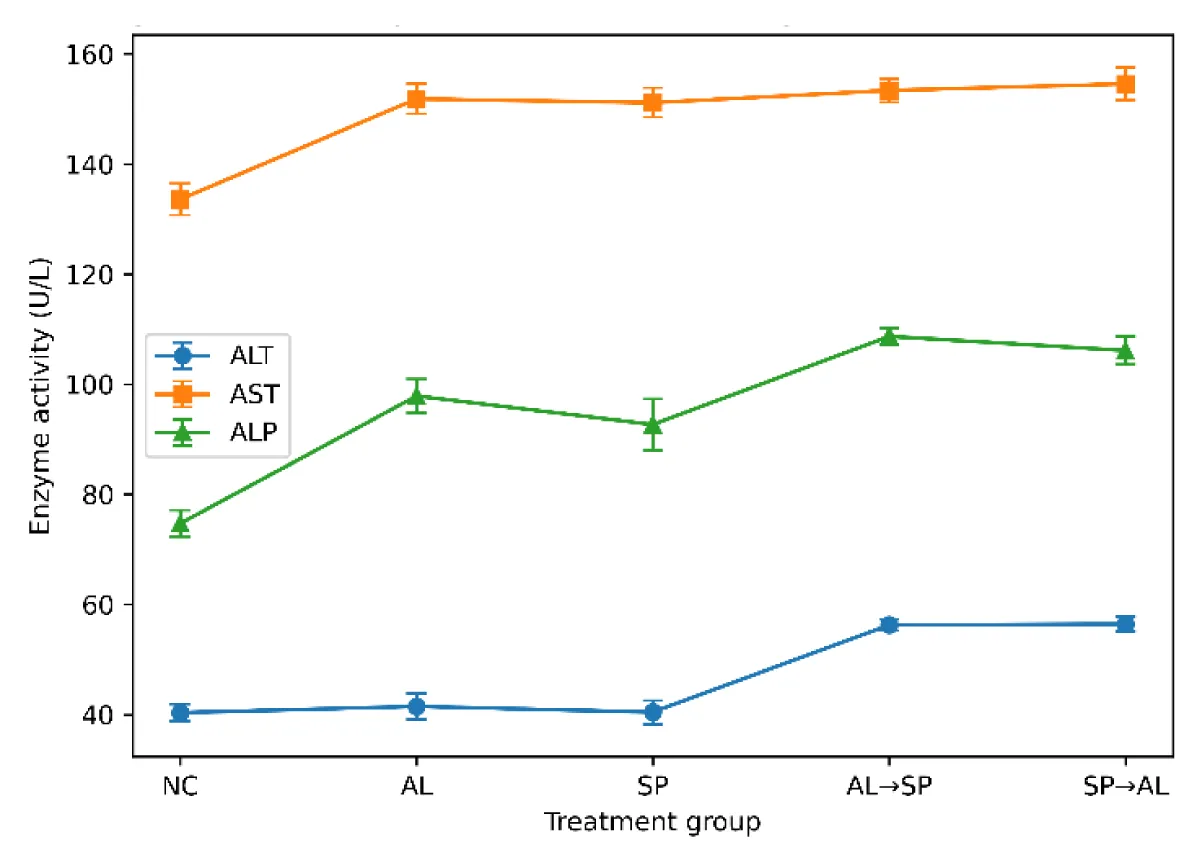
Figure 1: Liver enzyme biomarkers following AL and SP administration.
Ninety-five per cent confidence intervals (95% CI) were calculated for all outcome measures to provide an estimate of the precision of the observed group means. The corresponding confidence intervals for all biochemical parameters are presented in Supplementary Tables S1–S3.
Effects on kidney function
Serum concentrations of urea, creatinine, and electrolytes were analysed to ascertain kidney function. Significant (p ˂ 0.05) increases in serum urea and creatinine levels were observed in the sequential treatment with Artemether-Lumefantrine and Sulfadoxine-pyrimethamine compared with the control. There were no significant differences in serum electrolyte levels (sodium, potassium, chloride, and bicarbonate) when all treatment groups were compared with the control, as shown in Table 2 and Figure 2.
| Table 2: Biomarkers of kidney function in Wistar rats sequentially treated with Artemether-Lumefantrine and Sulfadoxine-Pyrimethamine. | ||||||
| Groups and Treatment | Urea (mmol/L) | Creatinine(mmol/L) | Sodium(mmol/L) | Potassium(mmol/L) | Chloride(mEq/L) | Bicarbonate(mmol/L) |
| Group 1 NC | 4.21 ± 0.35 | 103.80 ± 2.31 | 127.01 ± 0.12 | 1.66 ± 0.14 | 55.91 ± 0.66 | 15.15 ± 0.50 |
| Group 2 AL | 5.19 ± 0.37a | 104.32 ± 1.76 | 129.42 ± 5.09 | 1.52 ± 0.04 | 53.06 ± 3.26 | 16.02 ± 0.86 |
| Group 3 SP | 5.51 ± 0.16a | 112.67 ± 1.57ab | 128.70 ± 4.49 | 2.03 ± 0.39 | 51.42 ± 4.60 | 15.75 ± 2.26 |
| Group 4 AL then SP | 5.89 ± 0.26a | 112.67 ± 1.95ab | 128.10 ± 2.95 | 1.91 ± 0.18 | 57.47 ± 0.48 | 16.59 ± 0.77 |
| Group 5 SP then AL | 6.01 ± 0.19a | 117.05 ± 1.69ab | 133.15 ± 2.55 | 1.90 ± 0.18 | 58.07 ± 0.55 | 18.88 ± 1.07 |
| Data presented as Mean ± Standard Error of Mean (SEM). Means of groups were compared and considered significantly different at (p < 0.05). Significant differences are indicated as superscripts defined thus: ‘a’ = significantly different compared with Group 1; ‘b’ = significantly different compared with Group 2; ‘c’ = significantly different compared with Group 3; ‘d’ = significantly different compared with Group 4. NC – Normal Control; AL – Artemether-Lumefantrine; SP – Sulfadoxine-Pyrimethamine,.n=6 | ||||||
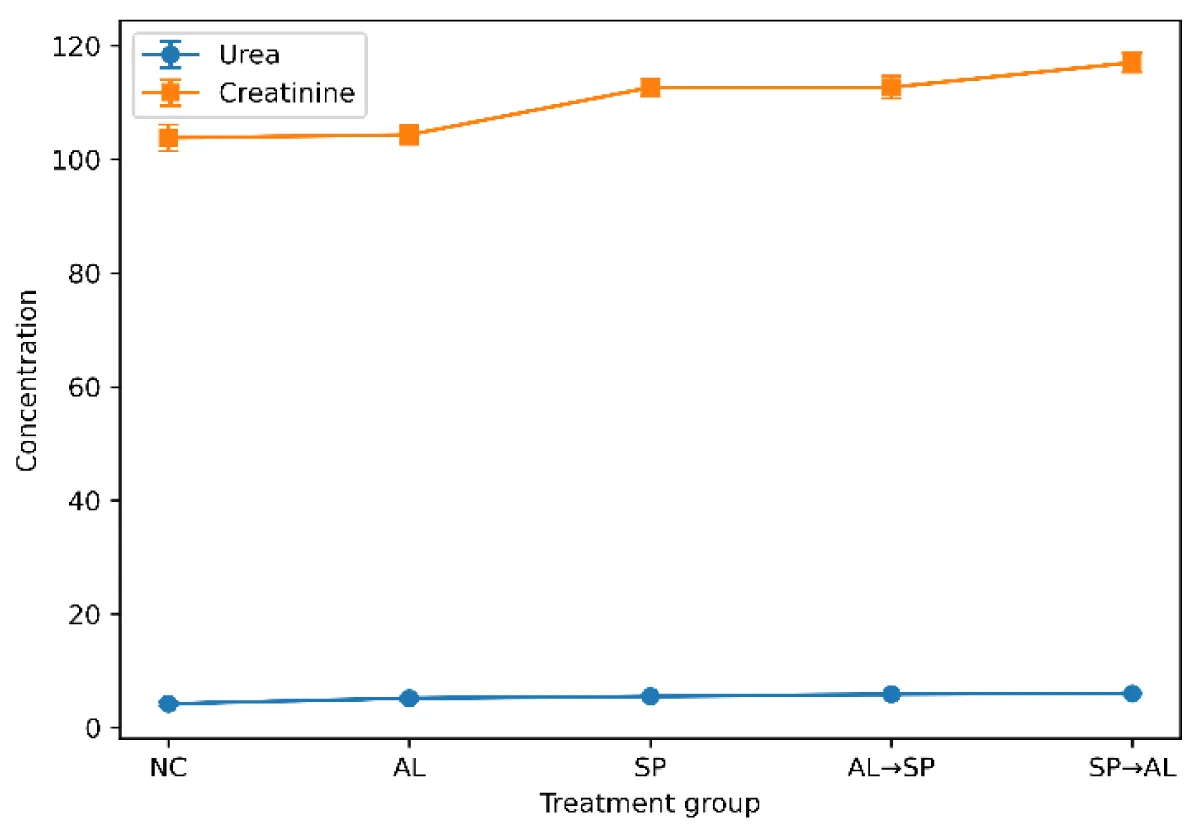
Figure 2: Renal biochemical markers following AL and SP administration.
Effect on lipid parameters
The total cholesterol (TCHOL), triacylglyceride (TAG), high-density lipoprotein (HDL), low-density lipoprotein (LDL), and very low-density lipoprotein (VLDL) in Wistar rats sequentially administered Artemether-Lumefantrine and Sulfadoxine-pyrimethamine are presented in Table 3 and Figure 3. Serum high-density cholesterol concentration was significantly (p < 0.05) increased with sequential treatment with Sulfadoxine-pyrimethamine and Artemether-Lumefantrine compared with the control. Group 5 (SP then AL) showed significant differences (p < 0.05) in the serum.
| Table 3: Lipid profile of Wistar rats sequentially treated with Artemether-Lumefantrine and Sulfadoxine-Pyrimethamine | |||||
| Groups and Treatment | TCHOL(mmol/L) | TAG(mmol/L) | HDL(mmol/L) | LDL(mmol/L) | VLDL(mmol/L) |
| Group 1 NC | 2.49 ± 0.06 | 1.09 ± 0.07 | 1.16 ± 0.07 | 0.83 ± 0.06 | 0.50 ± 0.03 |
| Group 2 AL | 2.91 ± 0.22 | 0.88 ± 0.07a | 1.19 ± 0.14 | 1.33 ± 0.11a | 0.40 ± 0.03a |
| Group 3 SP | 3.04 ± 0.22a | 1.06 ± 0.07 | 1.42 ± 0.07 | 1.14 ± 0.16 | 0.48 ± 0.03 |
| Group 4 AL then SP | 2.43 ± 0.06bc | 1.02 ± 0.05 | 1.06 ± 0.08c | 0.91 ± 0.08b | 0.46 ± 0.02 |
| Group 5 SP then AL | 2.94 ± 0.11d | 1.15 ± 0.08b | 1.49 ± 0.11abd | 0.93 ± 0.11b | 0.52 ± 0.03b |
| Data presented as Mean ± Standard Error of Mean (SEM). Means of groups were compared and considered significantly different at (p < 0.05). Significant differences are indicated as superscripts defined thus: ‘a’ = significantly different compared with Group 1; ‘b’ = significantly different compared with Group 2; ‘c’ = significantly different compared with Group 3; ‘d’ = significantly different compared with Group 4. NC – Normal Control; AL – Artemether-Lumefantrine; SP – Sulfadoxine-Pyrimethamine; TCHOL= Total Cholesterol, HDL = High Density Lipoprotein, TAG = Triacylglyceride, VLDL = Very Low Density Lipoprotein, LDL = Low Density | |||||
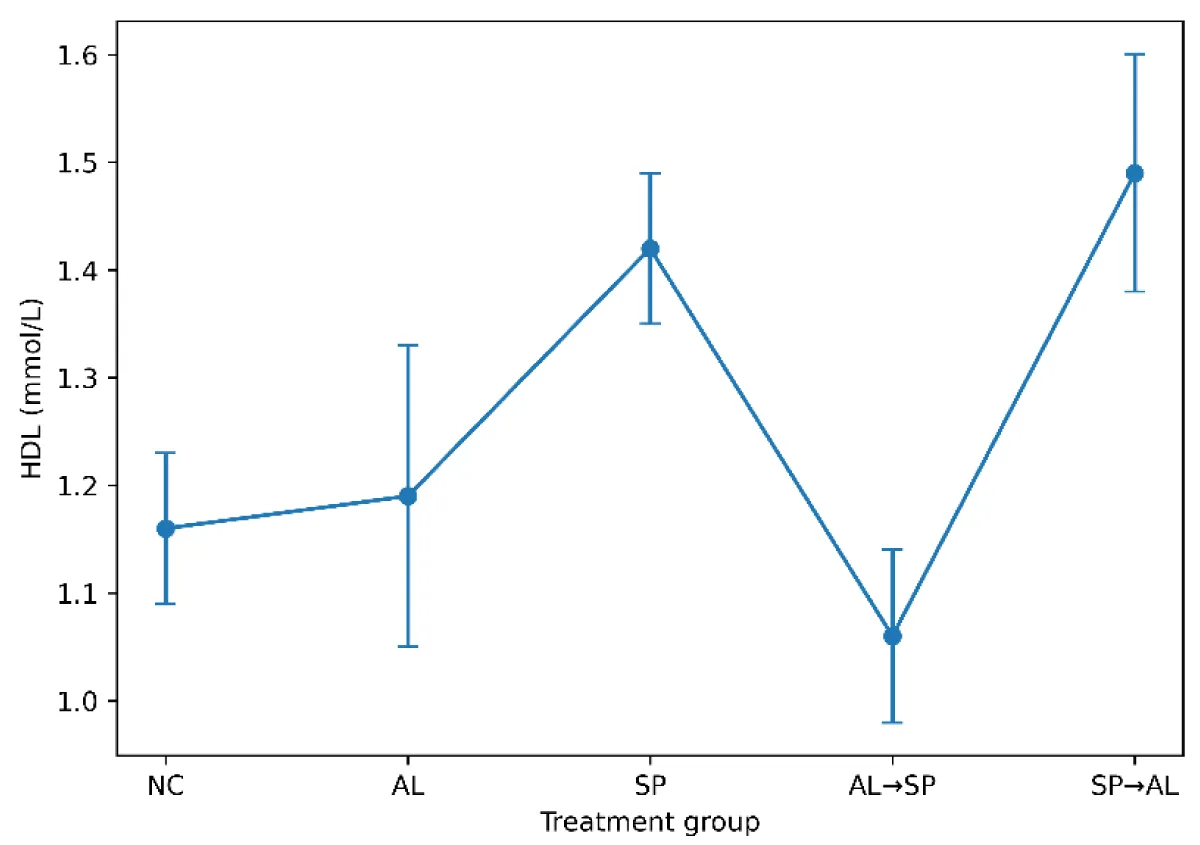
Figure 3: Serum HDL levels following independent and sequential treatment.
TCHOL, TAG, LDL, and VLDL concentrations following sequential treatment with Sulfadoxine-pyrimethamine and Artemether-Lumefantrine when compared to the independent AL treatment group. Additionally, Group 4 (AL then SP) showed a significant difference in Total Cholesterol compared to the independent SP group. Notably, HDL levels were significantly increased (p < 0.05) in the SP then AL sequence compared to the control, independent AL, and AL then SP groups.
Effects of independent and sequential administration of Artemether–Lumefantrine (AL) and Sulfadoxine–Pyrimethamine (SP) on liver enzymes (ALT, AST, ALP), renal markers (urea, creatinine), and serum high-density lipoprotein (HDL) levels in Wistar rats. Data are expressed as mean ± SEM (n = 6).
Hepatocyte membrane distortion is associated with increased permeability and subsequent leakage of intracellular enzymes into the circulation, as evidenced by elevations in serum alanine aminotransferase (ALT), aspartate aminotransferase (AST), and alkaline phosphatase (ALP), which are generally considered biomarkers of hepatocellular injury [22]. Among these, ALT is usually the most reliable indicator of hepatocellular damage, whereas AST, although found in hepatocytes, is also present in extrahepatic tissues such as cardiac and skeletal muscles, kidneys, and testes, making its elevation not only hepatic in origin [23].
In this study, AST levels were elevated in all treatment groups and were statistically significant compared with the normal control, indicating systemic enzyme leakage following both independent and sequential drug administration. Similarly, ALP levels were significantly higher in treated groups, especially sequentially treated animals. However, ALT activity was significantly elevated following sequential administration (Groups 4 and 5) but not with independent administration of AL or SP (Groups 2 and 3), suggesting that combined exposure may produce greater hepatocellular biochemical disturbance or stress than independent administration of either drug alone. This is corroborated by other studies showing that combined malaria regimens resulted in elevated ALT levels [24-27]. Meanwhile, in a Preclinical study in rodent malaria models conducted by Okafor, et al. [28], it was observed that artemisinin-based combination therapies induce histopathological changes in multiple organs, including the liver and kidneys.
Furthermore, a modest increase in total and direct bilirubin was observed, mainly in the sequential treatment groups, indicating some impairment of hepatobiliary processing and conjugation. However, this may reflect early functional disturbance rather than established liver damage. Interestingly, single SP administration caused relatively less enzyme induction than AL, which may explain why SP continues to be safely used in intermittent malaria prevention programs.
The sequence-specific biochemical effects could be partly explained by the liver’s metabolism of these drugs. Artemether, for example, is extensively metabolised in the liver by CYP3A4 and CYP2B6. Some studies suggest that artemisinin induces these enzymes through auto-induction, which could alter the metabolism and clearance of a drug administered afterwards [29,30]. SP, by contrast, has slower clearance and longer systemic exposure. Drugs with extended elimination phases are thought to be more prone to enzyme-mediated interactions, potentially leading to metabolic competition and accumulation of reactive intermediates [31,32]. This may have contributed to the more pronounced effect on group 5. Conversely, the administration of AL before SP may have induced the metabolism of the second drug so rapidly that the biochemistry was altered to a greater extent. Once again, this is speculative, but it is consistent with the results of previous studies on the pharmacokinetics-toxicodynamics of drug interactions [29,30].
Sequential administration also seemed to affect renal biomarkers. Serum urea and creatinine were significantly elevated in the SP → AL group, suggesting possible alterations in renal function and reduced glomerular filtration [33,34]. However, in the absence of histopathological assessment and additional functional studies, these findings should be interpreted as evidence of biochemical renal stress rather than confirmed nephrotoxicity. Electrolytes remained generally within normal limits, indicating that the kidney’s regulatory mechanisms remained functional. The fluctuations in electrolyte levels could be due to a slight decrease in kidney efficiency, as observed in earlier studies of antimalarial administration [35-37].
Additionally, in this study, there were sequence-dependent changes in lipid parameters. HDL increased significantly in the SP → AL group compared to the control, independent AL, and AL → SP groups. Interestingly, independent administration of SP (Group 3) resulted in significantly elevated Total Cholesterol compared to the control. In contrast, the sequential AL → SP group (Group 4) showed significantly lower Total Cholesterol levels than both independent AL and SP treatments. Furthermore, while independent AL treatment (Group 2) caused a significant reduction in TAG and VLDL compared to the control, sequential SP → AL administration resulted in significantly higher levels of these lipids compared with the AL group. Elevated lipid levels have been associated with an increased risk of cardiovascular disorders, including atherosclerosis and coronary heart disease [35,38-41].
In the present study, these findings suggest that the biochemical response to treatment may vary according to the sequence of drug administration. However, the clinical relevance of these alterations remains uncertain and warrants further investigation in longer-term experimental and clinical studies.
Limitations
The present findings are based on short-term biochemical assessments obtained after a four-day exposure period and therefore should not be extrapolated directly to clinical settings. Although significant alterations in liver and kidney biomarkers were observed, these measurements provide indirect evidence of organ function and do not establish the presence of structural tissue injury. Histopathological examination, oxidative stress assessment, inflammatory biomarker profiling, and functional evaluations were not performed; therefore, the observed changes should be interpreted as biochemical alterations or possible hepatorenal stress rather than confirmed toxicity [42-53].
Furthermore, the study was not designed to investigate the pharmacokinetic mechanisms underlying the sequence-dependent effects observed following sequential administration of artemether–lumefantrine and sulfadoxine–pyrimethamine. Consequently, any mechanistic explanations regarding altered drug exposure, metabolism, or elimination remain hypothetical and require experimental verification. Future studies incorporating histopathological evaluation, oxidative stress biomarkers, inflammatory markers, pharmacokinetic analyses, longer observation periods, larger sample sizes, formal effect-size estimation, and graphical presentation of individual animal data are needed to determine the biological significance, reversibility, magnitude, and mechanistic basis of the observed alterations.
This study shows that the biochemical effects of Artemether–Lumefantrine and Sulfadoxine–Pyrimethamine are influenced by the sequence of administration in male Wistar rats. Independent administration of Artemether–Lumefantrine (once daily for three days) or a single dose of Sulfadoxine–Pyrimethamine produced only mild and largely physiological changes in serum biochemical indices. However, sequential exposure resulted in more pronounced alterations, with the Sulfadoxine–Pyrimethamine-Artemether–Lume-fantrine sequence showing higher elevations in hepatic and renal biochemical biomarkers.
Ethical approval
All experimental procedures were conducted in accordance with institutional guidelines for the care and use of laboratory animals and were approved by the University of Uyo Faculty of Basic Medical Sciences Research Ethics Committee (Approval No. UU_FBMSREC_2025_002).
Informed consent: This does not apply to this article as no human subjects were involved in this study.
Declaration of conflicting interests: The authors declare that there are no potential conflicts of interest with respect to the research, authorship, and/or publication of this article.
Funding
The authors received no financial support for the research, authorship, and/or publication of this article.
- Lamesgen A, Engidaw M, Gedif G, Gete M, Belay YA. The economic burden of malaria in Africa: a systematic review of cost of illness studies. Malaria Journal. 2025 Jul 9;24(1):223. Available from: https://doi.org/10.1186/s12936-025-05390-x
- World Health Organisation. World malaria report 2024: Addressing inequity in the global malaria response. Geneva: WHO; 2024.
- Matlani M, Kojom LP, Mishra N, et al. Severe Plasmodium vivax malaria trends in the last two years: a study from a tertiary care centre, Delhi, India. Ann Clin Microbiol Antimicrob. 2020; 19:49. Available from: https://doi.org/10.1186/s12941-020-00393-9.
- World Health Organisation. World malaria report 2025: addressing the threat of antimalarial drug resistance. Geneva: World Health Organisation; 2025. Available from: https://www.who.int/teams/global-malaria-programme/reports/world-malaria-report-2025
- World Health Organisation. Guidelines for the treatment of malaria. 2nd ed. Geneva: WHO; 2010.
- Ngasala BE, Malmberg M, Carlsson AM, Ferreira PE, Petzold MG, Blessborn D, et al. Efficacy and effectiveness of artemether-lumefantrine after initial and repeated treatment in children< 5 years of age with acute uncomplicated Plasmodium falciparum malaria in rural Tanzania: a randomised trial. Clinical Infectious Diseases. 2011 Apr 1;52(7):873-82. Available from: https://doi.org/10.1093/cid/cir066
- World Health Organisation. Guidelines for malaria. 3rd ed. Geneva: WHO; 2021.
- Nosten F, White NJ. Artemisinin-based combination treatment of Plasmodium falciparum malaria. Am J Trop Med Hyg. 2007;77(6 Suppl):181-92.
- Nwaiwu O, Okorie PN, Orji AU. Persistent malaria transmission in sub-Saharan Africa despite intervention efforts: A systematic review. Infect Dis Poverty. 2023; 12:46.
- Makanga M, Krudsood S. The clinical efficacy of artemether/lumefantrine (Coartem®). Malar J. 2009;8(Suppl 1): S5. Available from: https://doi.org/10.1186/1475-2875-8-S1-S5
- Pecoul B, Chirac P, Trouiller P, Pinel J. Access to essential drugs in poor countries: a lost battle?. Jama. 1999 Jan 27;281(4):361-7. Available from: https://doi.org/10.1001/jama.281.4.361
- Lopez J, Carl A. Burtis and David E. Bruns: Tietz Fundamentals of Clinical Chemistry and Molecular Diagnostics, 7th ed. Elsevier, Amsterdam, 1075 pp, ISBN 978-1-4557-4165-6. Indian J Clin Biochem. 2015 Apr;30(2):243. Available from: https://doi.org/10.1007/s12291-014-0474-9.
- Idowu ET, Alimba CG, Olowu EA, Otubanjo AO. Artemether-Lumefantrine treatment combined with albendazole and ivermectin induced genotoxicity and hepatotoxicity through oxidative stress in Wistar rats. Egyptian Journal of Basic and Applied Sciences. 2015 Jun 1;2(2):110-9. Available from: https://doi.org/10.1016/j.ejbas.2015.03.001
- Xiong Y, Huang J. Anti-malarial drug: the emerging role of artemisinin and its derivatives in liver disease treatment. Chin Med. 2021 Aug 18;16(1):80. Available from: https://doi.org/10.1186/s13020-021-00489-0.
- Zang M, Zhu F, Li X, Yang A, Xing J. Auto-induction of phase I and phase II metabolism of artemisinin in healthy Chinese subjects after oral administration of a new artemisinin-piperaquine fixed combination. Malar J. 2014 Jun 3;13:214. Available from: https://doi.org/10.1186/1475-2875-13-214.
- Young DS. Effects of Drugs on Clinical Laboratory Tests. 3rd ed. Washington (DC): AACC Press; 1990.
- Young DS, Pestaner LC, Gibberman V. Effects of drugs on clinical laboratory tests. Clin Chem. 1975;21(5):1D-432D.
- Doumas BT, Perry BW, Sasse EA, Straumfjord Jr JV. Standardisation in bilirubin assays: evaluation of selected methods and stability of bilirubin solutions. Clinical chemistry. 1973 Sep 1;19(9):984-93. Available from: https://doi.org/10.1093/clinchem/19.9.984
- Henry RJ. Clinical Chemistry: Principles and Techniques. 2nd ed. Hagerstown (MD): Harper & Row; 1974.
- Wybenga DR, Di Giorgio J, Pileggi VJ. Manual and automated methods for urea nitrogen measurement in whole serum. Clinical Chemistry. 1971 Sep 1;17(9):891-5.
- Friedewald WT, Levy RI, Fredrickson DS. Estimation of the concentration of low-density lipoprotein cholesterol in plasma, without use of the preparative ultracentrifuge. Clin Chem. 1972;18(6):499-502. Available from: https://doi.org/10.1093/clinchem/18.6.499.
- Umezulike AJ, Maduka SO, Njoku-Oji NN, Okonudo PO, Nwaefulu K, Eluemunor M, et al. Comparative effects of some common vegetable oils on lipid profile and liver function in male Wistar rats. Int J Innov Sci Res Technol. 2021;6(12):1201-12.
- Shipman AR, Shipman KE. Investigative algorithms for disorders affecting plasma transaminases (aspartate transaminase and alanine transaminase)-a narrative review. Journal of Laboratory and Precision Medicine. 2024 Jan 1;9:14. Available from: https://doi.org/10.21037/jlpm-23-64
- Moosavy SH, Eftekhar E, Davoodian P, Nejatizadeh A, Shadman M, Zare S, Nazarnezhad MA. AST/ALT ratio, APRI, and FIB-4 compared to FibroScan for the assessment of liver fibrosis in patients with chronic hepatitis B in Bandar Abbas, Hormozgan, Iran. BMC Gastroenterology. 2023 May 11;23(1):145. Available from: https://doi.org/10.1186/s12876-023-02780-w
- Akam U, Okon E, Edem E. Effect of chloroquine, amodiaquine, quinine and halofantrine on serum enzymes. J Pharm Biol Sci. 2013;15(8):33-35.
- Farombi A, Ademola B, Olatunde M. Effect of coartem and p-alaxin on pregnant albino Wistar rats. Asian Journal of Biochemical Science. 2000;16(7):66-69.
- Olugbenga MA, Obot O O, Oluwatoyin HA. Effect of artemisinin-based combination therapy on the liver and kidney of patients attending University Health Centre. Niger J Pharm Appl Sci Res. 2020;7(2):28-32.
- Okafor UE, Ufele AN, Nwankwo OD. Effects of artemisinin based combination therapy on histopathology of the liver, kidney and spleen of mice infected with Plasmodium berghei. Anim Res Int. 2019;16(3):3519-3528.
- Xing J, Kirby BJ, Whittington D, Wan Y, Goodlett DR. Evaluation of P450 inhibition and induction by artemisinin antimalarials in human liver microsomes and primary human hepatocytes. Drug Metabolism and Disposition. 2012 Sep 1;40(9):1757-64. Available from: https://doi.org/10.1124/dmd.112.045765
- Asimus S, Elsherbiny D, Hai TN, Jansson B, Huong NV, Petzold MG, Simonsson US, Ashton M. Artemisinin antimalarials moderately affect cytochrome P450 enzyme activity in healthy subjects. Fundamental & Clinical Pharmacology. 2007 Jun;21(3):307-16. Available from: https://doi.org/10.1111/j.1472-8206.2007.00471.x
- Miyake T, Tsutsui H. Quantitative prediction of human pharmacokinetic drug-drug interactions and drug clearance using humanised liver chimeric mice: a review. Drug Metabolism and Pharmacokinetics. 2026 Jan 8:101517. Available from: https://doi.org/10.1016/j.dmpk.2026.101517
- Brunton LL, Knollmann BC, Hilal-Dandan R, editors. Goodman & Gilman's the pharmacological basis of therapeutics. New York: McGraw-Hill Education; 2018.
- Edagha IA, Ekpo AJ, Edagha EI, Bassey JV, Nyong TP, Akpan AS, Obeten RF, Okon AS, Ating BA. Investigating the comparative effects of six artemisinin-based combination therapies on Plasmodium-induced hepatorenal toxicity. Nigerian Medical Journal. 2019 Jul 1;60(4):211-8. Available from: https://doi.org/10.4103/nmj.NMJ_152_18
- Gowda S, Desai PB, Kulkarni SS, Hull VV, Math AA, Vernekar SN. Markers of renal function tests. North American journal of medical sciences. 2010 Apr;2(4):170.
- Abolaji AO, Eteng MU, Omonua O, Adenrele Y. Influence of coadministration of artemether and lumefantrine on selected plasma biochemical and erythrocyte oxidative stress indices in female Wistar rats. Human & Experimental Toxicology. 2013;32(2):206-215. Available from: https://doi.org/10.1177/0960327112464666
- Gallafassi EA, Bezerra MB, Rebouças NA. Control of sodium and potassium homeostasis by renal distal convoluted tubules. Brazilian Journal of Medical and Biological Research. 2023;56:e12392. Available from: https://doi.org/10.1590/1414-431X2023e12392
- Rodan AR. Regulation of distal nephron transport by intracellular chloride and potassium. Nephron. 2023 Apr 4;147(3-4):203-11. Available from: https://doi.org/10.1159/000526051
- Ndem JI, Sylvanus PU, Bassey UE, Effiong BO, Ewere EG. Assessing the effect of concomitant administration of artemether-lumefantrine and ciprofloxacin on some cardiac parameters in Wistar rats: "The remedial role of vitamin E." GSC Biol Pharm Sci. 2021;17(01):094-104. Available from: https://doi.org/10.30574/gscbps.2021.17.1.0276
- Ofem OE, Nna VU, Archibong AN, Bassey SC. Alteration in Serum Lipid Profile following Separate Administration of Anti-Malarial Drugs (Coartem and Chloroquine): A Comparative Study. Pharm Chem. 2014 Sep 24;6(4):415-21.
- Amsterdam EA, Wenger NK, Brindis RG, Casey Jr DE, Ganiats TG, Holmes Jr DR, et al. 2014 AHA/ACC guideline for the management of patients with non-ST-elevation acute coronary syndromes: a report of the American College of Cardiology/American Heart Association Task Force on Practice Guidelines. Circulation. 2014 Dec 23;130(25):e344-426.
- März W, Kleber ME, Scharnagl H, Speer T, Zewinger S, Ritsch A, Parhofer KG, von Eckardstein A, Landmesser U, Laufs U. HDL cholesterol: reappraisal of its clinical relevance. Clinical Research in Cardiology. 2017 Sep;106(9):663-75. https://doi.org/10.1007/s00392-017-1106-1
- Abdel-Ghaffar WH, Abdelghffar EA. Pathophysiological effects of Tamiflu on liver and kidneys of male rats. Beni-Suef University Journal of Basic and Applied Sciences. 2022 Jan 25;11(1):15. Available from: https://doi.org/10.1186/s43088-021-00189-6
- Abolaji AO, Eteng MU, Omonua O, Adenrele Y. Influence of coadministration of artemether and lumefantrine on selected plasma biochemical and erythrocyte oxidative stress indices in female Wistar rats. Human & Experimental Toxicology. 2013;32(2):206-215. Available from: https://doi.org/10.1177/0960327112464666
- Al-faris OJ, Al-Shawi NN, Kako MD. Possible cardiac adverse effects induced by therapeutic doses of ciprofloxacin in juvenile rats. Iraqi Journal of Pharmaceutical Sciences. 2012;21(2):94-7. Available from: https://doi.org/10.31351/vol21iss2pp94-97
- Amorha KC, Ugwuowo OB, Ayogu EE, Nduka SO, Okonta MJ. Evaluation of the hepatic effect of concomitant administration of ciprofloxacin and some antimalarial drugs in Plasmodium berghei infected mice: An in vivo study. Pakistan journal of pharmaceutical sciences. 2018 Sep 1;31(5).
- Badawy FA, Ali AA, Esmail NS, HelmyAbdelhady AH. Hyperchloremia in Critically Ill Patients in ICU. The Egyptian Journal of Hospital Medicine. 2022 Jan 1;86(1):532-7. Available from: https://doi.org/10.21608/ejhm.2022.213813
- Chen S, Chiaramonte R. In creatinine kinetics, the glomerular filtration rate always moves the serum creatinine in the opposite direction. Physiological Reports. 2021 Aug;9(16):e14957. Available from: https://doi.org/10.14814/phy2.14957
- Lala V, Zubair M, Minter D. Liver Function Tests [Updated 2023 July 30]. StatPearls. 2024:1-3. Available from: https://www.ncbi.nlm.nih.gov/books/NBK482489/
- Nagami GT. Hyperchloremia–Why and how. Nefrologia. 2016 Jul 1;36(4):347-53. Available from: https://doi.org/10.1016/j.nefro.2016.04.001
- KDIGO Work Group. KDIGO clinical practice guideline for the evaluation and management of chronic kidney disease. Kidney Int Suppl. 2013;3(3):1.
- Edikpo N, Okonkwo PO, Adikwu E. Effect of artemether treatment on plasma lipid profile in malaria. Pharmacology & Pharmacy. 2014;5(07):646-56.
- Ugian EA, Dasofunjo K, Nwangwa JN, Asuk AA, Akam MS, Ajing EN, et al. Effect of artemisinin-based combination therapy on some selected liver function indices of pregnant Wistar Albino rats. Journal of Applied Pharmaceutical Science. 2013 Sep 30;3(9):152-4. Available from: https://dx.doi.org/10.7324/JAPS.2013.3926
- Ukpanukpong RU, Eteng MU, Dasofunjo K. Antioxidant interactions of pefloxacin, garlic, vitamins C and E on lipid profile level of albino Wistar rats. J Appl Pharm Sci. 2013;3(3):167–70